The Australian Energy Market Operator, AEMO, recently released its Quarterly Energy Dynamics report for the third quarter of 2023, 1 July through 30 September.
While it didn’t say anything at all about GloBird Energy’s Free Lunch (that’s not the sort of thing it covers), we’ve taken the liberty of reading between the lines to see how the report’s findings back our innovative concept of incentivising people to use more energy in the middle of the day.
The QED Q3 2023 report makes it abundantly clear that there is more and more solar-generated energy available in the middle of the day and more and more Australians appear to be on the same page as us, using that plentiful supply of electricity when it’s available.
Of course, not all of them are on an eligible GloBird Energy plan that allows them to use electricity for free for two hours in the middle of the day, but at least they share our intent to make the most of renewable energy.
What the QED report is all about
AEMO prepares its Quarterly Energy Dynamics (QED) report to provide energy market participants and governments with information on market dynamics, trends and outcomes.
This particular quarterly report compares results for the just-completed quarter against other recent quarters, focusing on the previous quarter, Q2 2023, and the equivalent quarter one year earlier, in this case Q3 2022.
Geographically, the report covers:
The National Electricity Market (Queensland, New South Wales, the Australian Capital Territory, Victoria, South Australia and Tasmania).
The Wholesale Electricity Market and domestic gas supply arrangements operating in Western Australia.
The gas markets operating in Queensland, New South Wales, Victoria and South Australia.
What are the main findings of this edition?
We think the report makes very interesting reading. If you’d like to check out the 64-page report in full, you can download a PDF version from the AEMO website.
In summary, the main ‘headlines’ are:
- Warmer weather and increased distributed photovoltaic output reduced operational demand.
- We saw reduced wholesale prices despite a reduction in black-coal-fired capacity.
- As gas and black-coal-fired output declined, there were increases in grid-scale solar and distributed PV.
- We set new actual and potential instantaneous renewable penetration records.
- East coast gas prices were under half Q3 2022 levels, as demand and production trended downwards.
The lowest demand ever
Because of above-average winter temperatures across Australia, there was a decrease in underlying demand in most National Electricity Market (NEM) regions in Q3 2023.
Distributed photovoltaic (PV) output grew to an average 2,287 megawatts (MW), up 31% on Q3 2022 and a new high for any Q3.
Both factors drove average NEM operational demand to a new Q3 low of 21,270 MW.
Numerous minimum demand records were set this quarter, notably the NEM as a whole reaching an all-time minimum demand of 11,393 MW on Sunday 17 September, 499 MW below the previous record set in Q4 2022.
South Australia’s minimum operational demand was 21 MW in the half-hour ending 1330 hrs on 16 September, when distributed PV output represented 98.5% of underlying demand.
More solar, both grid-scale and distributed PV
Grid-scale solar output increased by 412 MW from Q3 2022, driven predominantly by new and recently commissioned units in Queensland and New South Wales.
Coupled with the abundance of distributed PV – essentially solar energy generated by household rooftop photovoltaic arrays – this saw new marks set for the penetration of instantaneous renewable energy (that is, not stored in batteries and distributed later).
A new instantaneous renewable penetration record was set in the half-hour period ending 1230 hrs on Thursday 21 September, when 70.0% of total NEM generation came from renewable sources. This was a 1.3 percentage point increase from the previous record set in Q4 2022.
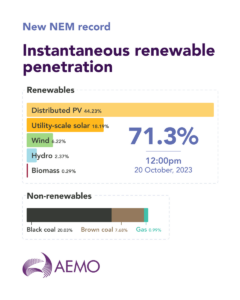
This high point has already been surpassed a couple of times in October, with AEMO’s X account (@AEMO_Energy) reporting that on Friday 20 October the NEM “hit a new instantaneous renewable penetration record of 71.3% for the 30 minutes ending 12:00pm”.
As the accompanying AEMO chart (below) shows, at that time rooftop solar supplied 44.23% of total electricity generated.
Greater capacity is being added to the NEM
The other thing we found interesting in the QED Q3 2023 report is how much new generation capacity is being commissioned and connected.
At the end of Q3 2023, 33 gigawatts (GW) of new capacity was progressing through the connection process from application to commissioning, with one-third of this capacity in new applications submitted during the past six months.
The total capacity of in-progress applications was 19.2 GW, compared to 7.7 GW at the same time last year. There has been a marked influx of applications during the past two quarters, with applications totalling 5.6 GW received in Q3 and 5.1 GW in Q2.
What about that abundance of solar in the middle of the day?
Before we wrap up, let’s just go back to have a look at what’s happening in the midday to 2pm window of the GloBird Energy Free Lunch.
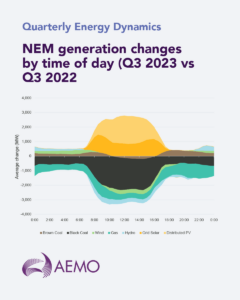
This post on AEMO’s X account confirms what we already knew: there’s a lot more solar energy in the mix in the middle of the day, and a lot less coal-generated electricity.
To save you a click, the post says “Total #electricity supply by fuel type saw renewables contribute 38.9% of total supply, up 4.6%. The increase in rooftop and grid-scale #solar in the middle of the day offset reduced output from black coal-fired generation, which saw the largest decrease for a single fuel source.” and includes this AEMO graph:
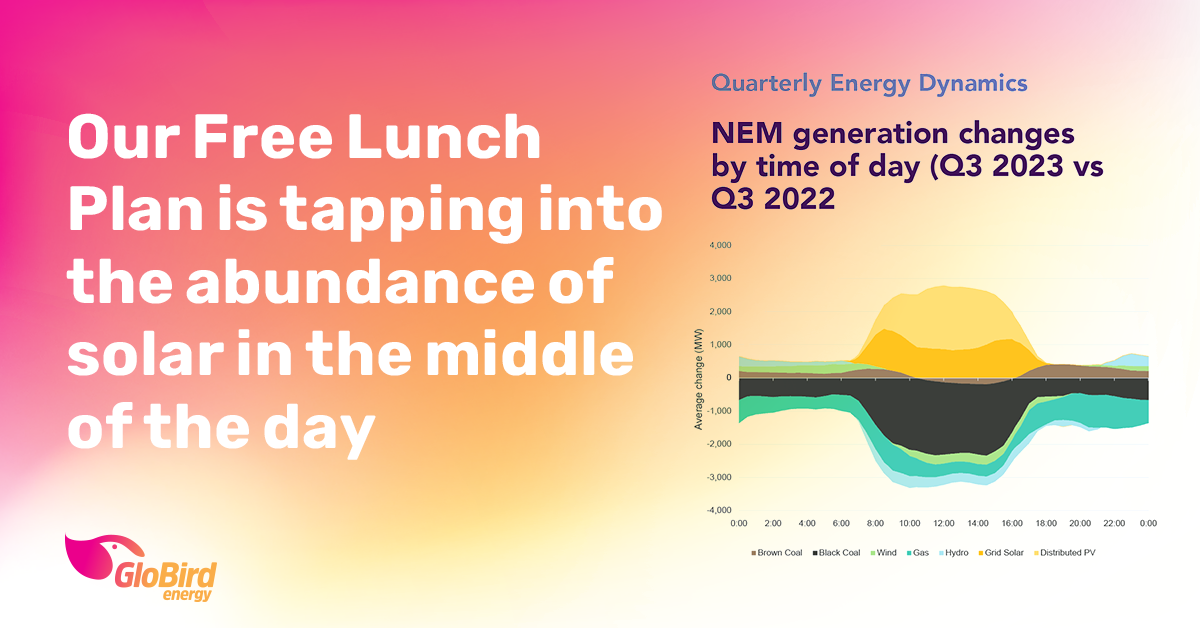
Yes, that’s a lot more solar-generated energy in the middle of the day than even the same time last year.
So, if you live in Victoria or SA, have a smart meter, and agree that it’s time you had a Free Lunch, check out the plan here.


