We’ve spent the past couple of posts looking at aspects of the Australian Competition and Consumer Commission’s (ACCC) preliminary report of its Retail Electricity Pricing Inquiry, firstly summarising some of the most significant things the report had found and then digging a bit deeper into what the inquiry had identified as the main reasons for increased electricity prices in Australia over the past decade.
This time we’re going to take a look at some of the comparisons the report has made between the figures relating to the situation here in Victoria and the other states that are part of the NEM (Queensland, NSW, the ACT, South Australia, and Tasmania), and between electricity prices in Australia and those found elsewhere in the world.
The NEM
As we explained in a previous post, the NEM is the interconnected power system in Australia’s eastern states that we often refer to as ‘the grid’.
It’s one of the world’s largest interconnected power systems, stretching from Port Douglas in Queensland all the way down to Tasmania and across to South Australia, and supplying approximately nine million customers.
There are over 100 registered participants in the NEM, including market generators, transmission network service providers, distribution network service providers, and market customers.
The NEM began operating in 1998.
Deregulation
Deregulation of the Victorian electricity industry began with privatisation in the mid-90s, and continued with full retail contestability in 2002, before price deregulation was introduced for all consumers in 2009.
Many people point to deregulation alone as the genesis of higher prices for consumers, however the ACCC report suggests that’s not the case.
It states:
“For some time after the NEM was established, markets appeared to be working effectively with new investment in generation and, in 2014, the AER (Australian Energy Regulator) generally found that Victorian and South Australian electricity distribution businesses, which had been privatised, were more efficient than other distribution businesses that remained under state ownership.
“In the early stages of retail contestability, in markets such as Victoria, there were signs that retail competition was developing and that, over time, an increasing number of consumers would be beneficiaries of competitive pricing and greater choice of services and new technologies.
“However, it is clear now that many of the policy, regulatory, and business decisions over the past decade or more have, on balance, led to higher prices for all consumers.”
Our summary:
- In general, competition is a good thing;
- Every policy or regulation change has a knock-on effect;
- It’s far too simplistic to blame deregulation for higher prices.
Victoria versus the rest
Although only a relatively small percentage of Victorian households (around nine per cent) are on standing offer electricity rates, the ACCC found that those were the best basis for comparison across states and territories in the NEM, as market offers vary too greatly to allow a comparison between like offers.
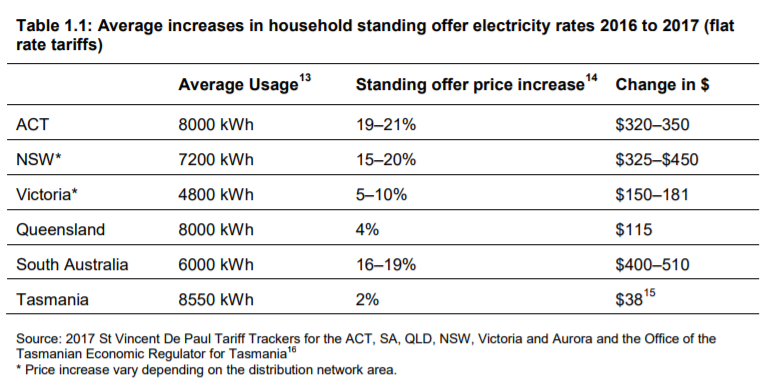
As you can see in the below table, the average increase in standing offers from 2016 to 2017 was far higher in South Australia, New South Wales, and the Australian Capital Territory than we saw in Victoria.
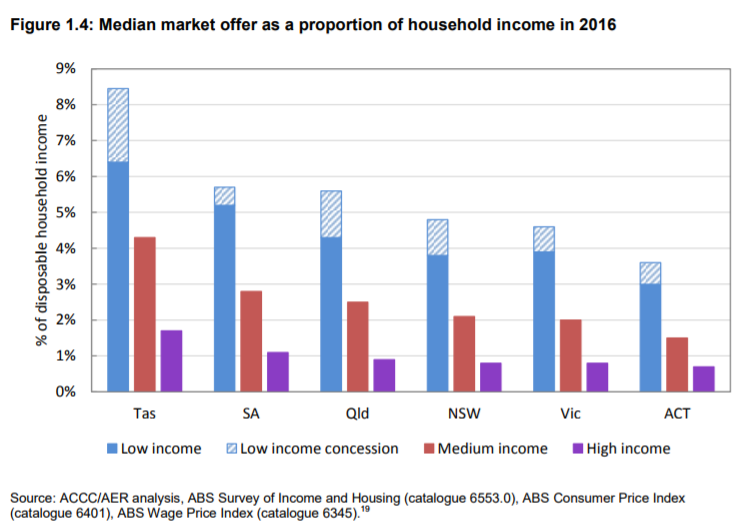
Unfortunately, as has been reported previously, the ACCC’s analysis confirmed that higher electricity prices disproportionately affect those segments of society least able to afford that burden, in other words, lower-income households.
That’s clearly indicated in the below table which shows the percentage of disposable household income that’s needed to pay the ‘average’ electricity bill in each state.
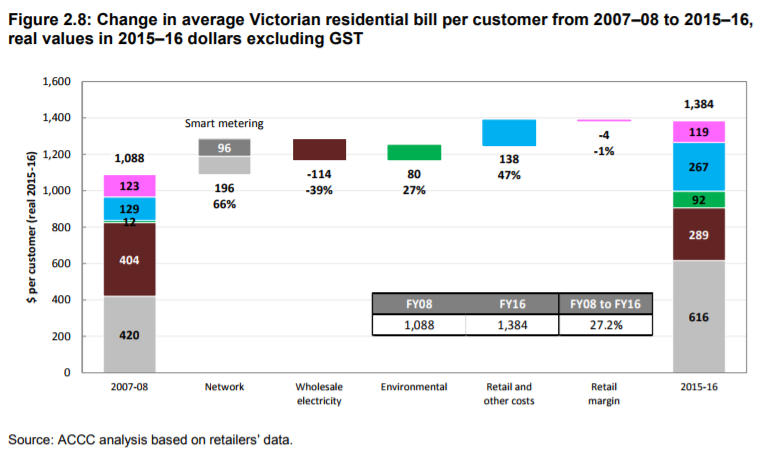
Looking specifically at what’s happened in Victoria over the nine years between 2007-08 and 2015-16, the average electricity bill has increased about 27 per cent.
As you can see in the table below, network costs and retail costs increased significantly, while the wholesale cost of electricity and retail margins reduced – although, as previously noted, the wholesale cost of electricity in Victoria has risen markedly in the 12 to 18 months since the period covered (in part due to the closure of the Hazelwood coal-fired power station).
International comparison
Every year, the Australian government reports the average national electricity price to the International Energy Agency, which compiles data for the OECD (Organisation for Economic Co-operation and Development).
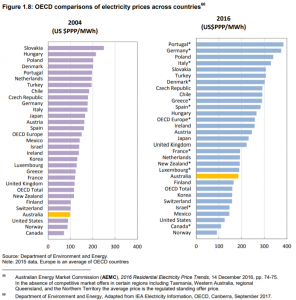
In 2004, Australia was the fourth cheapest of the OECD-reporting nations, and below the OECD average, but in 2016, Australia’s average price was above the OECD average and only 10th cheapest.
Having said that, every other country – including the cheapest like the United States, Canada, and Norway – has seen increases, too.
As you can see in this table, the average price in Portugal and Germany is about double Australia’s.
What does it all mean?
We’re not trying to draw any conclusions from this data, simply sharing some of the information that the ACCC is in the process of collecting and analysing, as published in its preliminary report (which, by the way, runs to over 150 pages).
However, the ACCC inquiry is going to draw some conclusions and make recommendations. The Commission has only just finished taking further submissions in response to this preliminary report.
In our next blog post, we’ll look at what the report has found about the impact of electricity prices on consumers.
If you haven’t read our previous two blogs, you can find them here:
Why Australian energy prices keep going up
What the ACCC report has discovered about electricity pricing
